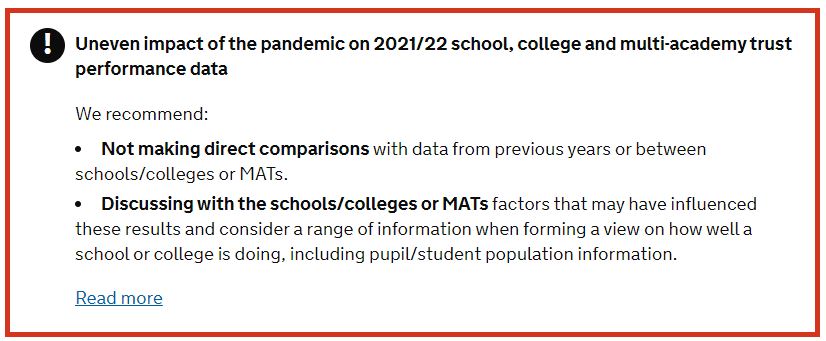
Due ot the Covid-19 Pandemic assessment results for 2019/20 were not published as performace measures. Historic performance dat can be found below. N.B. These are not current. (dated March 2022)
KS4 examination success and performance 2018-2023
|
Year 11 Performance Data |
2018 Validated |
2019 Validated |
2022 Validated |
2023 Provisional |
|
Progress 8 Score |
-0.18 |
-0.08 |
-0.17 |
-0.01 |
|
Average Attainment 8 score |
46.2 |
46.3 |
45.5 |
44.78 |
|
% achieving grade 5 or above in English and maths GCSEs |
38 |
41 |
39 |
39 |
|
% achieving grade 4 or above in English and maths GCSEs |
64 |
67 |
67 |
65 |
|
% entering the English Baccalaureate |
30 |
70 |
21 |
16 |
|
% achieving the English Baccalaureate at grade 5 or above |
6 |
15 |
6.5 |
9.7 |
|
% achieving the English Baccalaureate at grade 4 |
11 |
26 |
12 |
11.5 |
KS5 examination success and performance 2018-2023
|
2018 validated |
2019 provisional |
2022 Validated | 2023 Provisional | |
|
Number of 16-18 students at the end of A level study |
123 |
115 |
110 | 110 |
|
Number of full-time equivalent students at the end of A level study |
123 |
115 |
110 | 110 |
|
Number of A level entries (of those at the end of A level study) |
390 |
336 |
327 | 343 |
|
Average point score per A level entry |
35.37 |
32.51 |
33.35 | 31.10 |
|
Average point score per A level student |
112.13 |
101.35 |
99.13 | 97.09 |
|
% of students at the end of A level study achieving at least 3 A levels at A*-E |
94.3 |
90.4 |
83.9 | 91.82 |
|
% of students at the end of A level study achieving at least 2 A levels at A*-E |
100 |
95.7 |
97.4 | 100 |
|
% of students at the end of A level study achieving at least 1 A level at A*- |
100 |
100 |
100 | 100 |
|
% of grades at A and A* |
31 |
25 |
32 | 24 |
|
% of students at the end of A level study achieving grades AAB or higher in at least 2 facilitating subjects |
13.4 |
12.9 |
23.5 | 20.4 |
|
Average grade |
B- |
C+ |
C+ | C= |
|
L3VA |
0.18 |
0.03 |
N/A | N/A |
Department for Education Performance Tables: https://www.compare-school-performance.service.gov.uk/
Department for Education Performance Tables McAuley: https://www.compare-school-performance.service.gov.uk/school/140865/the-mcauley-catholic-high-school/secondary


